mercury-graph
Mercury Graph
What is this?
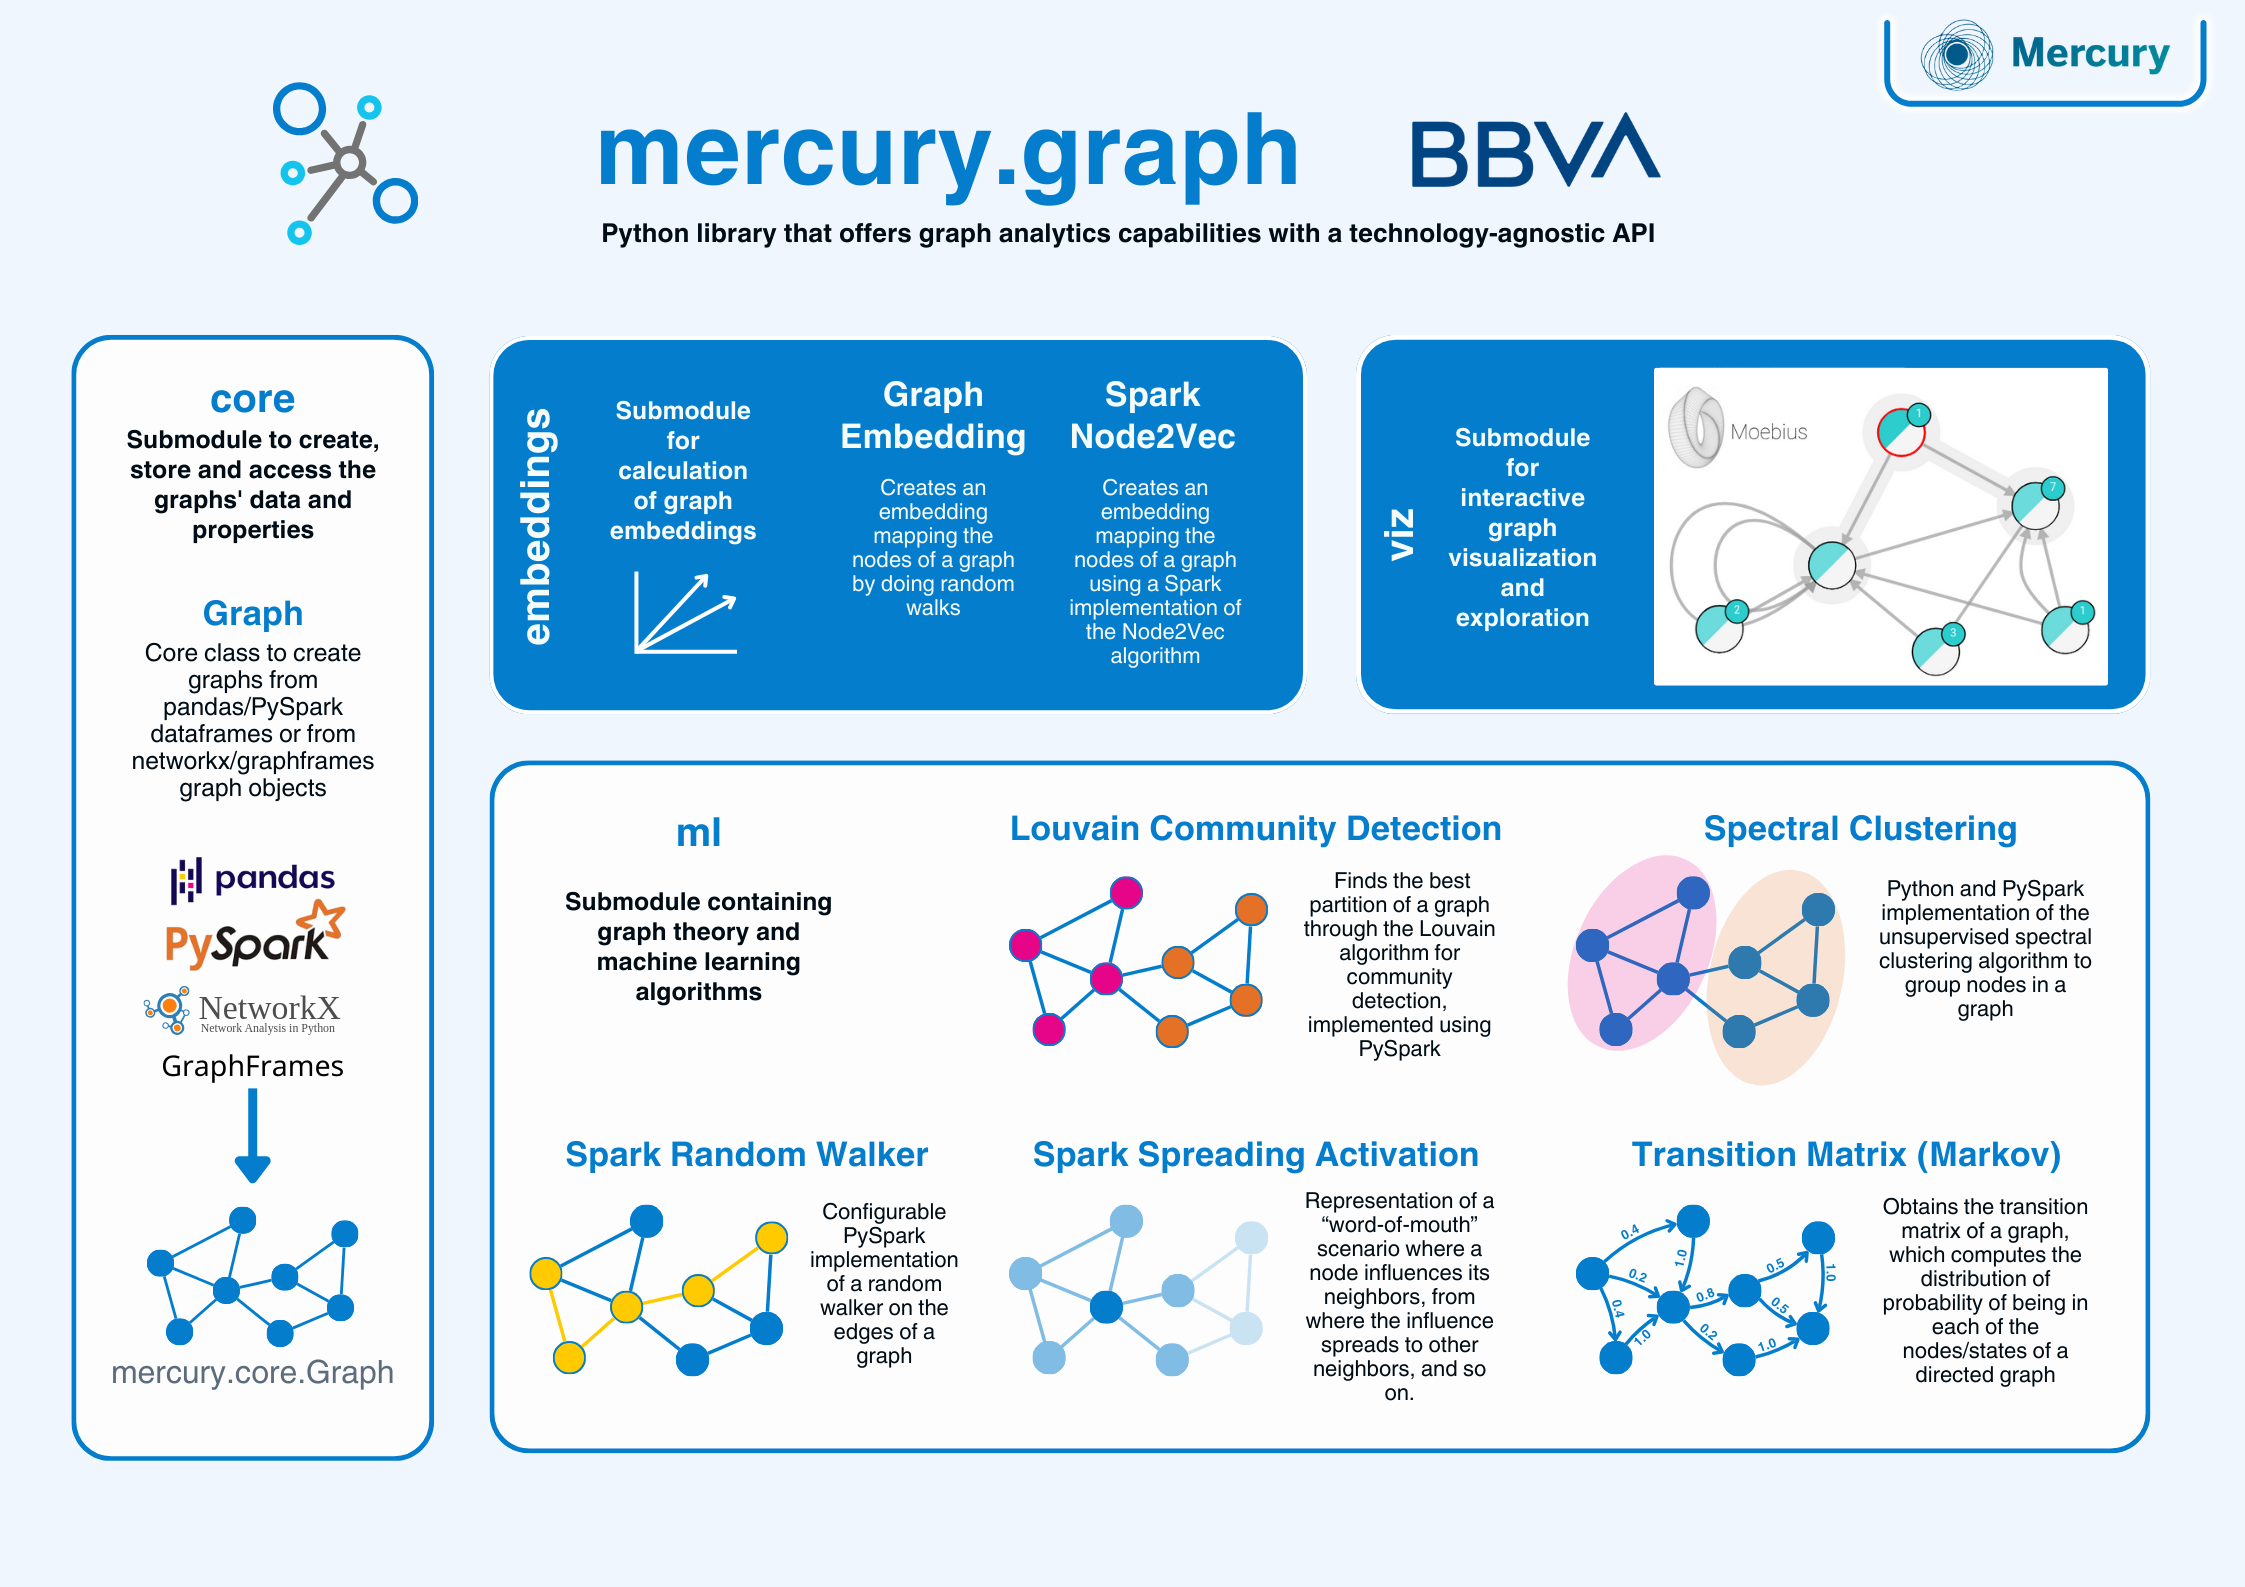
mercury-graph is a Python library that offers graph analytics capabilities with a technology-agnostic API, enabling users to apply a curated range of performant and scalable algorithms and utilities regardless of the underlying data framework. The consistent, scikit-like interface abstracts away the complexities of internal transformations, allowing users to effortlessly switch between different graph representations to leverage optimized algorithms implemented using pure Python, numba, networkx and PySpark GraphFrames.

Try it without installation in Google Colab
-
mercury.graph methods using the FIFA dataset
-
mercury.graph methods using the BankSim dataset
Install
pip install mercury-graph
Documentation
- HTML documentation: https://bbva.github.io/mercury-graph/site/
Testing
After installation, the test suite can be launched with coverage statistics from outside the source directory (packages pytest and coverage must be installed):
./test.sh
License
                         Apache License
                   Version 2.0, January 2004
                http://www.apache.org/licenses/

     Copyright 2021-23, Banco de Bilbao Vizcaya Argentaria, S.A.

   Licensed under the Apache License, Version 2.0 (the "License");
   you may not use this file except in compliance with the License.
   You may obtain a copy of the License at

       http://www.apache.org/licenses/LICENSE-2.0
Contributing
If you can complete a new feature on your own (new feature, doc, tests, version bump, changelog), you can directly create a Pull request to the master branch. Of course, you will get help via the PR.
An easier way to contribute is to create a new issue. If the idea is accepted, we will create a branch for you and start working on how to implement it.
Help and support
Mercury project at BBVA
mercury-graph is a part of Mercury, a collaborative library developed by the Advanced Analytics community at BBVA that offers a broad range of tools to simplify and accelerate data science workflows. This library was originally an Inner Source project, but some components, like mercury.graph, have been released as Open Source.
If you’re interested in learning more about the Mercury project, we recommend reading this blog post from BBVA AI Factory.


